For the first third of the school year, I focused on familiarizing myself with Omeka. Omeka is a web-publishing system, similar to a database, that we are using to run our website. It comes equipped with several “themes” and “plugins” to add user-interactivity to the website. I set myself up with a trial Omeka account, and downloaded and tested the functionality of over a dozen different plugins. I played around with Omeka and looked at different themes. Since I didn’t have any coding, specifically HTML, experience, this was all very new to me. Next, I started reading everything I could find about Malta until a became an expert on the country.
After I had understood Omeka more, I was ready to start with the content. I decided on the primary navigation for the website, which consists of a homepage with some pictures and descriptions, along with five main pages: About, Partners, Research, Teaching Resources, and a Contact page. After reviewing data collected on cisterns in Malta that Vanessa was using for her visualizations, I wrote the ‘About’ page and decided how to make the ‘Research’ page. The research is broken into sites we visit, data collection, and visualizations. Once Vanessa finishes her WebGL plugin, I’ll be able to include them on the visualizations page (but for now they just link to her visualizations on a different website). Next, I started with the Educational Modules. I started with the easiest first: a two-day 45-minute lesson plan for middle school Social Studies classes. Vanessa and I worked together to create the first in-class lesson, which is a fun activity that provides students with a solid background on how the history of Malta plays a role in shaping their water scarcity issues. Then I created a follow-up homework assignment using Vanessa’s WebGL cisterns, as well as a second lesson on water conservation for the following class period and a homework assignment to accompany the second lesson. Additionally, I solidified a logo design, homepage design, and “look and feel” for the site.
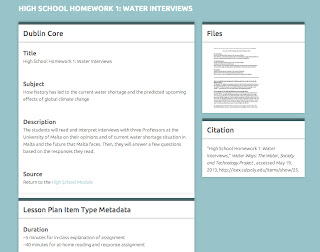
For the last two months, I’ve been trying to tackle editing the existing Omeka themes and plugins. I took an Introduction to Computer Programming class last quarter, and I am currently enrolled in a class where I’m learning some HTML, but it has still required a lot of outside reading and trial-and-error. Since Omeka was made to be really simple with a drag-and-drop interface, it actually makes it really difficult to edit, like to be able to add images and animation to the homepage. Finally, I was able to add a picture slideshow to the homepage, as well as a rotating cistern from Vanessa’s WebGL creation. After finally having the look for the site that I wanted, I created the second teaching module, which is aimed to be used by high school World History classes. The first in-class lesson is the same as the middle school one. For the homework assignment, students will read and answer questions about water scarcity and climate change effects from personal interviews that I conducted with three Professors at the University of Malta when I visited two months ago.
Since we still have a month of school left, I am going to create a third teaching module for University educators that will follow similar themes of how social and environmental factors tie together to shape Malta’s future in terms of water availability and climate change effects.


No comments:
Post a Comment